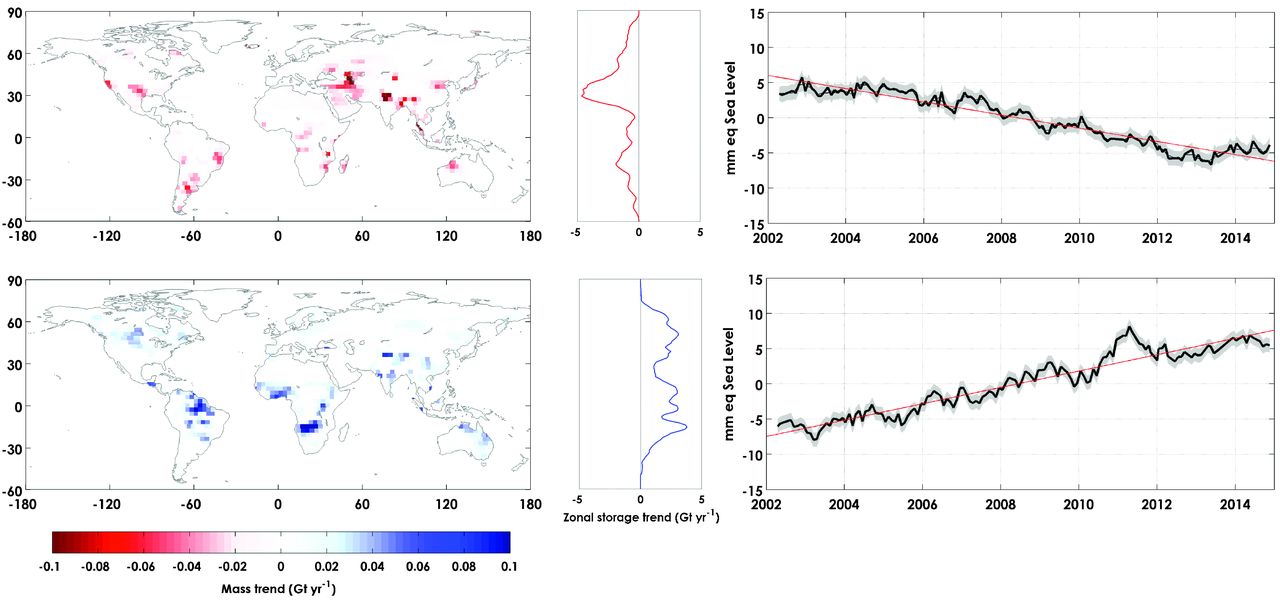
Fig. 2 (from Reager et al., 2016, Science) Storage trends partitioned into hydrologic gains and losses.
(Left) As in Fig. 1, but separated by negative (top) and positive (bottom) land water storage trends. (Middle) The zonal average of the negative (top) and positive (bottom) trend map (gigatons per year per 1/2-degree grid). (Right) GRACE land water storage time series averaged for the negative (top) and positive (bottom) land water storage trend map (climatology removed). Estimated glacier trends are shown in the supplementary materials (44).


